Financial Review

QUARTERLY STOCK PRICE INFORMATION, ISSUER PURCHASES OF EQUITY SECURITIES, DIVIDENDS, AND STOCK PERFORMANCE
QUARTERLY STOCK PRICE
Our common stock is traded on the NASDAQ Stock Market under the symbol MSFT. On July 20, 2011, there were 134,854 registered holders of record of our common stock. The high and low common stock sales prices per share were as follows:
| Quarter Ended | September 30 | December 31 | March 31 | June 30 | Fiscal Year | ||||
| Fiscal Year 2011 | |||||||||
| High | $ 26.41 | $ 28.87 | $ 29.46 | $ 26.87 | $ 29.46 | ||||
| Low | $ 22.73 | $ 23.78 | $ 24.68 | $ 23.65 | $ 22.73 | ||||
| Fiscal Year 2010 | |||||||||
| High | $ 26.25 | $ 31.50 | $ 31.24 | $ 31.58 | $ 31.58 | ||||
| Low | $ 22.00 | $ 24.43 | $ 27.57 | $ 22.95 | $ 22.00 |
SHARE REPURCHASES AND DIVIDENDS
Share Repurchases
On September 22, 2008, we announced the completion of the two repurchase programs approved by our Board of Directors during the first quarter of fiscal year 2007 to buy back up to $40.0 billion of Microsoft common stock. On September 22, 2008, we also announced that our Board of Directors approved a new share repurchase program authorizing up to $40.0 billion in share repurchases with an expiration date of September 30, 2013. As of June 30, 2011, approximately $12.2 billion remained of the $40.0 billion approved repurchase amount. The repurchase program may be suspended or discontinued at any time without prior notice.
We repurchased the following shares of common stock under the above-described repurchase plans using cash resources:
| (In millions) | Shares | Amount | Shares | Amount | Shares | Amount | |||||
| Year Ended June 30, | 2011 (a) | 2010 (a) | 2009 (b) | ||||||||
| First quarter | 163 | $ 4,000 | 58 | $ 1,445 | 223 | $ 5,966 | |||||
| Second quarter | 188 | 5,000 | 125 | 3,583 | 95 | 2,234 | |||||
| Third quarter | 30 | 827 | 67 | 2,000 | 0 | 0 | |||||
| Fourth quarter | 66 | 1,631 | 130 | 3,808 | 0 | 0 | |||||
| Total | 447 | $ 11,458 | 380 | $ 10,836 | 318 | $ 8,200 |
(a) All shares repurchased in fiscal years 2011 and 2010 were repurchased under the plan approved by our Board of Directors on September 22, 2008.
(b) Of the 318 million shares of common stock repurchased in fiscal year 2009, 101 million shares were repurchased for $2.7 billion under the plan approved by our Board of Directors during the first quarter of fiscal year 2007. The remaining shares were repurchased under the plan approved by our Board of Directors on September 22, 2008.
Dividends
In fiscal year 2011, our Board of Directors declared the following dividends:
| Declaration Date | Dividend Per Share | Record Date | Total Amount | Payment Date | |||
| (In millions) | |||||||
| September 21, 2010 | $ 0.16 | November 18, 2010 | $ 1,363 | December 9, 2010 | |||
| December 15, 2010 | $ 0.16 | February 17, 2011 | $ 1,349 | March 10, 2011 | |||
| March 14, 2011 | $ 0.16 | May 19, 2011 | $ 1,350 | June 9, 2011 | |||
| June 15, 2011 | $ 0.16 | August 18, 2011 | $ 1,340 | September 8, 2011 |
The dividend declared on June 15, 2011 will be paid after the filing of our 2011 Form 10-K and was included in other current liabilities as of June 30, 2011.
In fiscal year 2010, our Board of Directors declared the following dividends:
| Declaration Date | Dividend Per Share | Record Date | Total Amount | Payment Date | |||
| (In millions) | |||||||
| September 18, 2009 | $ 0.13 | November 19, 2009 | $ 1,152 | December 10, 2009 | |||
| December 9, 2009 | $ 0.13 | February 18, 2010 | $ 1,139 | March 11, 2010 | |||
| March 8, 2010 | $ 0.13 | May 20, 2010 | $ 1,130 | June 10, 2010 | |||
| June 16, 2010 | $ 0.13 | August 19, 2010 | $ 1,118 | September 9, 2010 |
The dividend declared on June 16, 2010 was included in other current liabilities as of June 30, 2010.
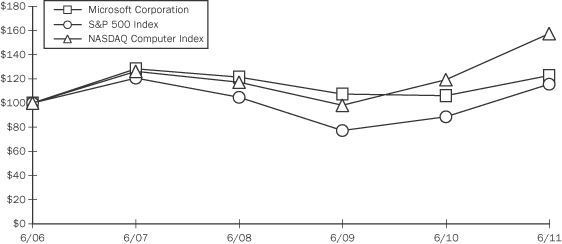
STOCK PERFORMANCE
COMPARISON OF 5 YEAR CUMULATIVE TOTAL RETURN*
Among Microsoft Corporation, the S&P 500 Index and the NASDAQ Computer Index
| 6/06
|
6/07
|
6/08
|
6/09
|
6/10
|
6/11
|
||||||
| Microsoft Corporation | 100.00 | 128.23 | 121.43 | 107.48 | 106.04 | 122.71 | |||||
| S&P 500 Index | 100.00 | 120.59 | 104.77 | 77.30 | 88.46 | 115.61 | |||||
| NASDAQ Computer Index | 100.00 | 126.19 | 117.22 | 98.11 | 119.30 | 157.48 |
*$100 invested on 6/30/06 in stock or index, including reinvestment of dividends